It’s September, and for many, September means harvest. It’s a critical moment when all the efforts of the past months come to fruition. It’s a critical moment because the grapes must be harvested at the optimal level of ripeness, with the correct sugar content, acidity, and polyphenolic complexity.
Then, there is the choice of harvesting method, whether mechanical or manual, how to optimize transport of the product to the winery, the selection of grapes before or after harvesting, as well as all the activities in the winery.
Fully understanding the state of ripeness is therefore one of the many elements to be taken into consideration. There are plenty of monitoring tools available, from destructive but rapid ones such as refractometers to more innovative and complex ones such as fluorescence systems.
However, one aspect that is lacking is the spatial analysis of grape ripeness, i.e., the different degrees of ripeness that can be found in different zones of the vineyard.
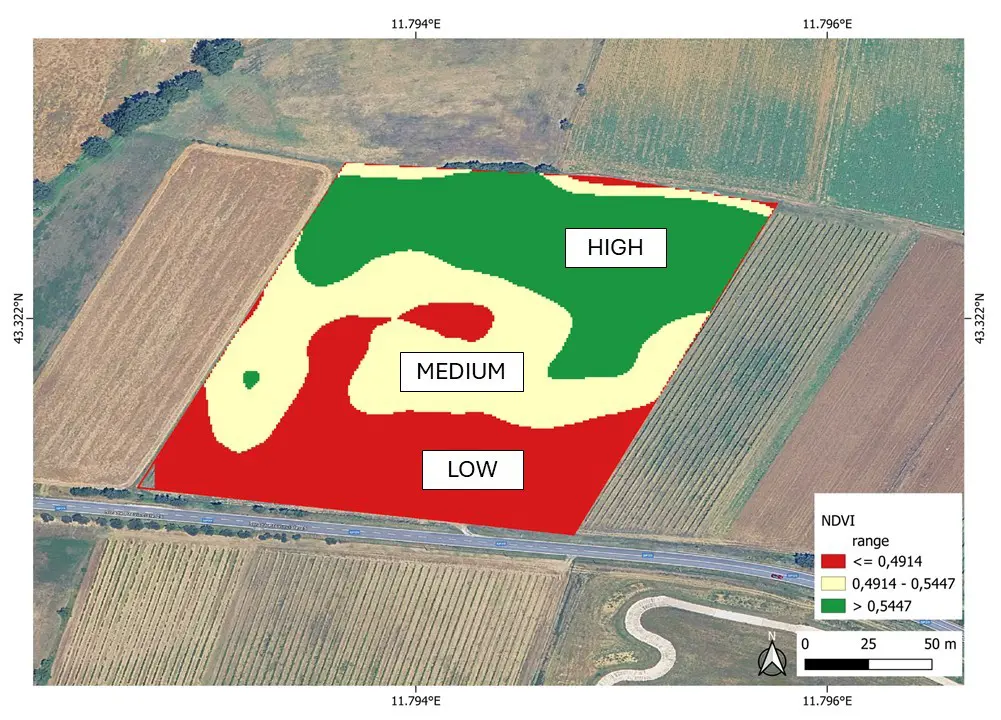
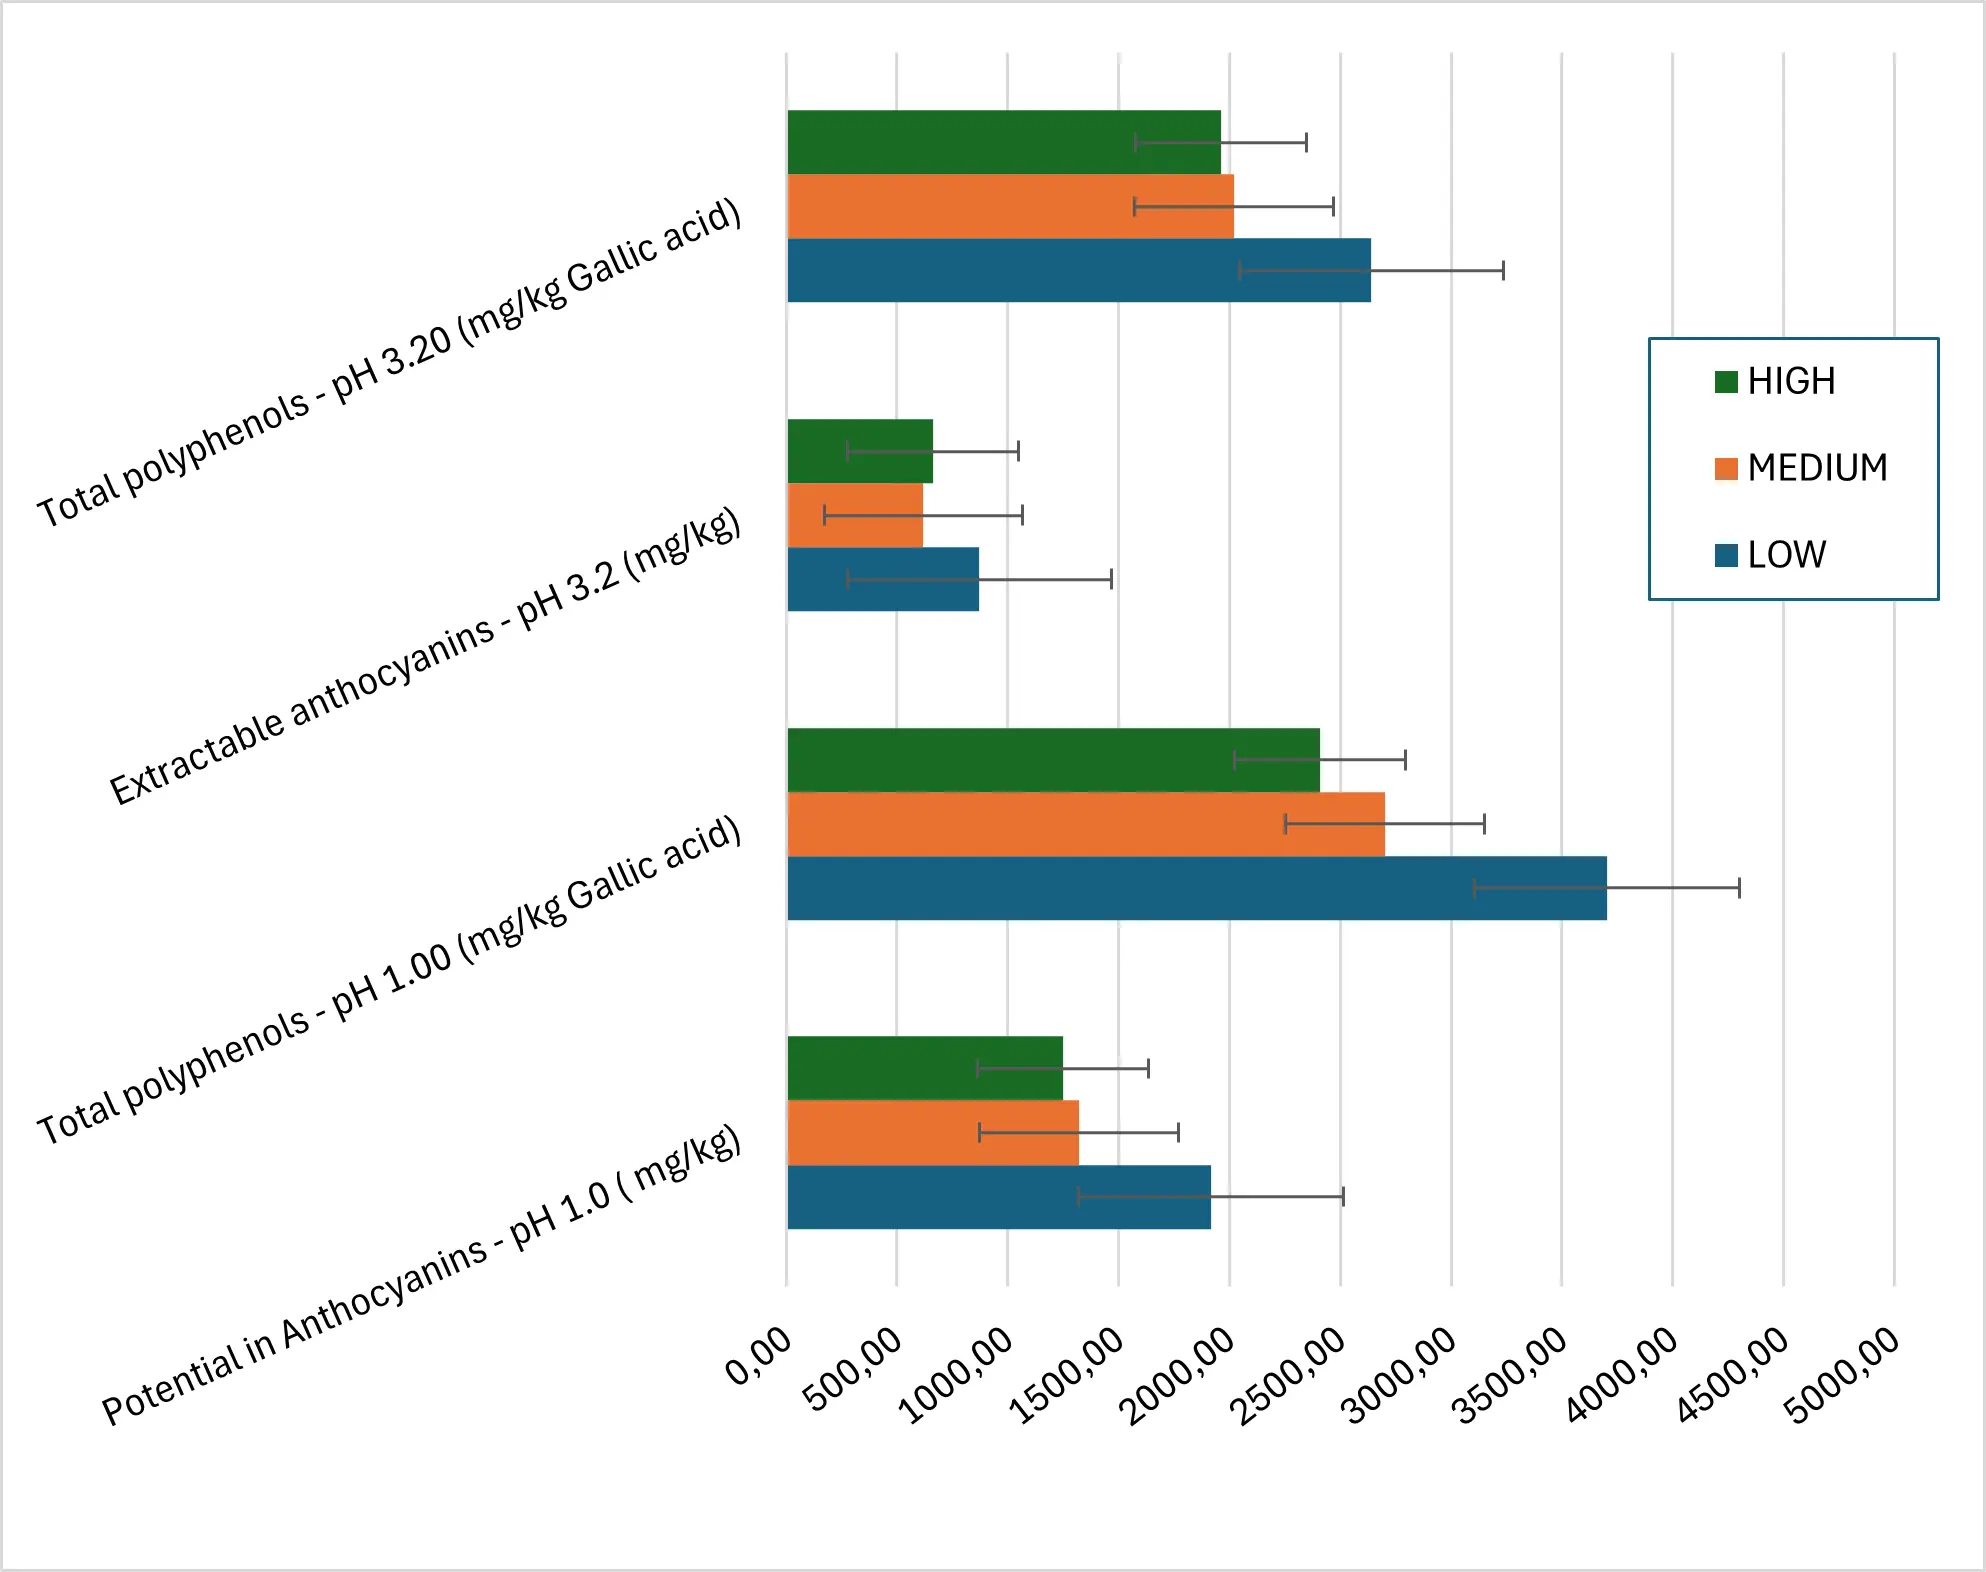
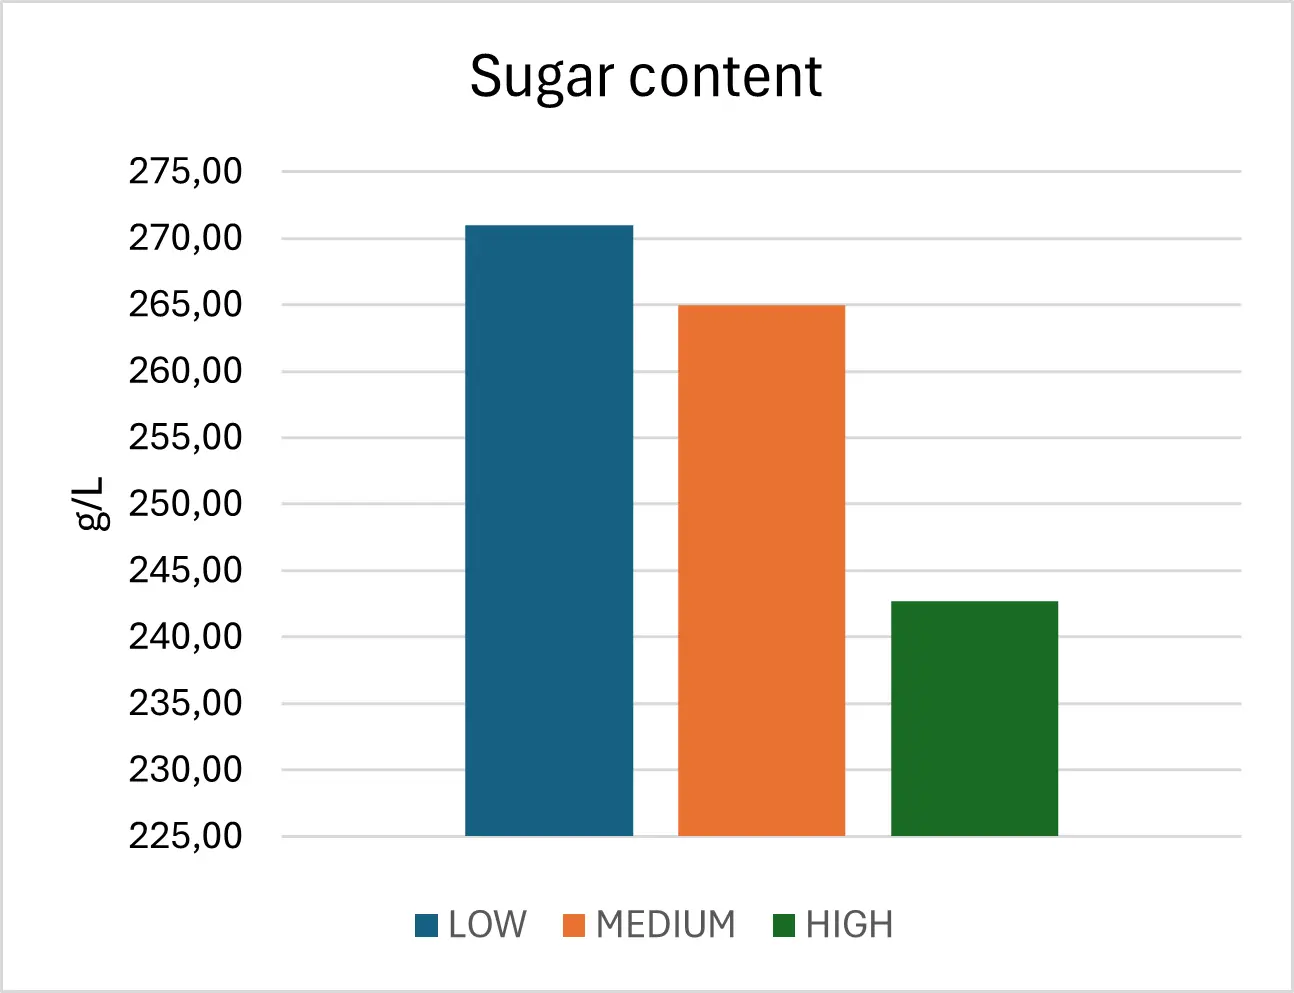
Let’s take the vineyard in the image as an example: there are areas with uneven vegetative vigor (highlighted by the NDVI index) that lead us to divide the vineyard into three areas, one with low vigor, one with medium vigor, and one with high vigor. These areas are not only differentiated by vegetative vigor, but also by the characteristics of the grapes. If we look at the graphs, this is evident!
Understanding what causes these different characteristics (e.g., a higher concentration of solutes in smaller or dehydrated grapes) is important to implement agronomic measures aimed at solving problems, but at harvest time it is essential to know how these characteristics change spatially to carry out a targeted and differentiated harvest based on the different qualities.